Notes Towards A Grammar of Graphics in Clojure
Part 1: Specification and Syntax
2024-03-15
Leland Wilkinson's magnum opus The Grammar of Graphics has set the standard by which any statistical graphics program must be judged, though few libraries make the attempt. By the second page, I knew I was reading the right book, because Wilkinson spells out the exact problems with the statistical plotting programs written both before and after the book's publication. It is well worth quoting at length:
1.1 Graphics Versus Charts
We often call graphics charts (from χάρτης or Latin charta, a leaf of paper or papyrus). There are pie charts, bar charts, line charts, and so on. This book shuns chart typologies. For one thing, chars are usually instances of much more general objects. Once we understand that a pie is a divided bar in polar coordinates, we can construct other polar graphics that are less well known. We will also come to realize why a histogram is not a bar chart and why many other graphics that look similar nevertheless have different grammmars.
There is also a practical reason for shunning chart typology. If we endeavor to develop a charting instead of a graphing program, we will accomplish two things. First, we inevitably will offer fewer charts than people want. Second, our package will have no deep structure. Our computer program will be unnecessarily complex, because we will fail to reuse objects or routines that function similarly in different charts. And we will have no way to add new charts to our system wthout generating complex new code. Elegant design requires us to think about a theory of graphics, not charts.
As I read this, it gave voice to the frustrations I've experienced using "basic" plotting libraries from matplotlib to Apache eCharts and even to Microsoft Excel. If you're reading this, you almost certainly have had the experience of trying to use a plotting library that had a nice-looking landing page or GitHub repository, only to find that there's a still-open GitHub issue over a two years old for a relatively minor aesthetic tweak to the display of a chart it offers. This passage explained to me why every single one of these tools falls short: they are not built on a sufficiently compositional foundation. The book offers that foundation in depth.
The reason why R programmers use ggplot2 and basically nothing else is because they don't need to. It remains the most faithful and complete implementation of the ideas outlined in the book, and my experience using plotting libraries in other programming languages pales in comparison - Clojure included, unfortunately. I hope what I write here can assist in remedying this deficiency: I think Clojure has the all the components necessary to build a first-rate implementation of Wilkinson's ideas, and even some characteristics that may, with sufficient effort, allow Clojure to surpass other implementations.
In this article I will offer a brief tour based on part 1 of the book, which introduces the idea of a grammar of graphics and outlines the syntax and components of a plot in terms general enough to encompass almost any kind of graphic derived from data. The ideas I sketch out here are highly preliminary; my intention is to use this article as a springboard for further discussions and prototype code as part of the broader scicloj efforts to build a more flexible and capable graphics system for data science and scientific computing in Clojure.
Part 2 of the book is on semantics: I will discuss more ideas about implementation there.
Chapter 1: Introduction
Wilkinson defines his project for graphics in this chapter after contrasting it with charts in the above quotation.
He argues that the only system flexible enough to produce the graphics is an object-oriented one. I will have more to say on this claim - particularly in the context of Clojure programs - later on. But for now, at risk of using a vague and frequently overloaded term, it is sufficient to note that the specification system outlined in this book is declarative: it focuses on first producing a specification of what is to be displayed, then assembling a graphical scene from that specification, and then finally produces a series of instructions for displaying the graphical scene by rendering it, will necessarily depend on the details of the output medium. This separation of specification, assembly, and display is critical, and I will have more to say about it later on.
A specification has six components:
- Data
A set of data operations that create variables from datasets.
(pg. 7) - Transformations
Transformations are mathematical functions that update variables or create new ones for the purposes of a graphic. - Scale
Scales map from the domain of one or more variables to the units in a graphical scene. - Coordinate System
... coordinates can be thought of more generally as schemes for mapping elements of sets to geometric objects.
(pg. 179) - Element
graphs (e.g. points), and their aesthetic attributes (e.g. color)
(pg. 7) - Guide
Guides label components of a graph to aid in understanding what it represents.
Chapter 2: How to Make a Pie
The recipe is for a pie chart displaying responses to questions about perceived gender bias in academic publishing in ACLS survey data. It consists of the following steps:
- Create variables
- Apply algebra
- Apply scales
- Compute statistics
- Construct geometry
- Apply coordinates
- Compute aesthetics
I have skipped over the definitions used to establish the underlying algebra of graphics (pg. 25-30). While these definitions are essential for ensuring the integrity of the formalism elucidated in detail in Chapter 5 — and by extension, any implementation — they are not necessary to see how the components of a graph fit together.
Chapter 3: Data
Wilkinson outlines several types of data that serve as the material from which graphics are constructed. Functions produce variables from datasets.
- Empirical
arise from observations of the world
(pg. 44).
Functionscol- mapping source data, a variable name, units of measurement, and weights to a column of empirical data.
mapa function from one set to another.
(pg. 366) - more general than a Clojure hash map, which would be a finite injective map. It's most analogous to themapfunction.streamfor streaming data sources
(pg. 42) - because of Clojure's sequence abstractions, this capability could likewise be handled by themapfunction.image- Produces an image. Could potentially just be a function over raster data, or a multidimensional version of
map. sample- Produce a variable by statistically sampling the given data or variable.
reshape- Transform a matrix or table of columns into a different shape.
- Abstract Data
arise from formal models
(pg 48).
Functionsiter- Generate a series - includes
count, proportion, percentas special cases. meshcompute a 1D, 2D, or 3D mesh.
(pg. 43)constant- Yield multiple instances of a constant - equivalent to
(repeat x item) rand- Generate numbers according to a probability distribution.
- Metadata
Metadata are data about data.
(pg. 51)
FunctionsmetaThe meta() function associates metadata with rows of datasets. ...[e]ach index in the source() of the meta() function might point to a video image, a Web address in the form of a [URL], or some other item of metadata.
(pg. 43).
Chapter 4: Variables
Variables are an abstraction over data. This distinction is important because many things can produce data: mathematical expressions, files recording observations, arithmetic sequences, or arbitrary Clojure functions. As Wilkinson says, the only requirement is that the variable mapping function return a single value in the range for every index
(pg. 55). Variables associate a concept we want to measure, like income, with a set of data, such as 3 months worth of paystubs.
Wilkinson presents many functions for working with variables. I have adapted the notation to a syntax more familiar to Clojure programmers to emphasize that these functions are vector rather than scalar functions - they operate on a variable as a whole.
- Mathematical
(log [x])(exp [x])(sin [x])(cos [x])(tan [x])(sign [x])(pow [x] p)
- Statistical
(mean [x])(median [x])(mode [x])(rank [x])(cut [x] k)(residual [x] [y])(grpfn [x] [g] fn)
- Multivariate
(sum [x₁] [x₂] … [xₙ])(diff [x₁] [x₂])(prod [x₁] [x₂])(quotient [x₁] [x₂])(influence [x₁] [x₂] … [xₙ])(miss [x₁] [x₂] … [xₙ] fn)
These are generally pretty self-explanatory. The rest of the chapter gives examples of the types of plots that can be produced with these functions. For our purposes, it is important to note that Wilkinson also intends this list to be open-ended and serve as a template for designing the signature and behavior of new functions
(pg. 56).
Chapter 5: Algebra
Chapter 6: Scales
Ideas from Part 1
Polymorphism and Extensibility
In Chapter 3, Wilkinson introduces subclassing for functions, giving examples like sample.boot (bootstrap sampling), reshape.diag (create a diagonal matrix), and rand.normal (sample from a given normal distribution). I prefer to think that Table 3.1, which introduces these functions, is generally illustrative rather than exhausive; any system designed to produce graphics should be flexible enough to introduce new functions that conform to the signature expected of each type of function. Clojure multimethods seem like a useful alternative to subclassing in this regard: one could imagine a sample multimethod that can be extended to dispatch to new functions for sampling data. This would allow users to use novel methods of sampling not enumerated in the original package in order to produce variables for their graphics.
I think this is one of the first areas where we can simplify the design laid out in Wilkinson's book using the capabilities of Clojure.
Improving on metadata
The second is in the realm of metadata. Wilkinson's specification for metadata is quite succinct: a simple mapping from named sources to values. It makes sense for the book not to dwell on this topic, as it is a book on graphics, not on information systems or ontology. While this is certainly enough for many types of metadata, Clojure has been influenced by languages and concepts with a much richer model for metadata. Expanding the idea of metadata to an EAVT model would allow for more expressive specification of provenance and other metadata, and for deeper integration with the Datalog and RDF-style systems favored by many in the Clojure community.
Existing systems derived from the Grammar of Graphics
ggplot2
As mentioned in the introduction, ggplot2 is the most widely used and, in my estimation, the best implementation of these ideas. A more detailed study of ggplot2's strengths is beyond the scope of this post, but I will have a bit more to say on it below.
Tableau
I don't have much experience with Tableau, so I can't comment on it in detail, but it has been cited as another widely used system that implements Wilkinson's formalism.
vega / vega-lite
Vega and Vega-lite, originally developed at the Interactive Data Lab at the University of Washington, provide two interfaces to the D3 JavaScript library for data visualization based on the ideas presented in The Grammar of Graphics. Vega-lite is a high-level way of specifying the "lower level" (but still an intermediate layer above D3 itself) specifications used by Vega. Vega-lite is more succinct, and vega is more flexible. There are plots that cannot be directly constructed in vega-lite, such as a topographic contour plot.
I do not have space in this essay to do a full-scale comparison of ggplot2 and vega. But I do want to spend some time discussing it in depth because Vega-lite has become the most commonly used library for data visualization in Clojure. In practial terms, this leads to several drawbacks for analytical workflows that I hope a more JVM-focused library can overcome.
Firstly, a browser becomes an essential part of any Clojure workflow involving data visualization. This adds a lot of complexity, because now the Clojure program must have a way of interoperating with the JavaScript used to render things in an interactive way. Clerk is a great library for this purpose, and is quite capable, but it still requires its users to learn and use different, specialized dialect of Clojure and know about the included JavaScript to extend the capabilities of things used to display Clojure values.
Secondly, the same data and variable transformations can be expressed in different languages. Because vega and vega-lite implement a signficant portion of the formalism described by Wilkinson, they have their own data and variable functions as described in Chapters 3 and 4. Using them can lead to an impedance mismatch between the JVM side and the vega side. To give a concrete example, consider a log-scale transformation on a dataset with 100,000 rows. This isn't a super large dataset, but sending it over the wire for rendering can slow down a notebook significantly. So frequently the best option is to perform a summary and aggregation on the JVM with tech.ml.dataset. If that summary involves a log-scale transformation, then the data sent over to vega will now be in a different set of units than those desired for display on the axis of the graphic, necessitating a transformation back to the original scale on the vega-lite side. As Wilkinson lays out in Chapter 6, the whole system must operate in a common set of units for consistent display of the dimensions of the data in a graphic. Having separate systems for computation and display hinders the ability of authors to tailor the graphic to their needs.
Thirdly, vega-lite implements two out of the three major components of Wilkinson's system. It eschews the operators of cross, nest, and blend and instead focuses on constructing the specification directly. This frequently makes them more verbose than an equivalent plot in ggplot2, which does implement the algebraic operators directly.
Compare two ways of defining a population pyramid plot:
Vega
{"$schema": "https://vega.github.io/schema/vega-lite/v5.json",
"description": "A population pyramid for the US in 2000, created using stack. See https://vega.github.io/vega-lite/examples/concat_population_pyramid.html for a variant of this created using concat.",
"data": { "url": "data/population.json"},
"transform": [
                {"filter": "datum.year == 2000"},
                {"calculate": "datum.sex == 2 ? 'Female' : 'Male'", "as": "gender"},
                {"calculate": "datum.sex == 2 ? -datum.people : datum.people", "as": "signed_people"}
                ],
"width": 300,
"height": 200,
"mark": "bar",
"encoding": {
"y": {"field": "age",
        "axis": null, "sort": "descending"},
"x": {"aggregate": "sum", "field": "signed_people",
        "title": "population",
        "axis": {"format": "s"}},
"color": {"field": "gender",
            "scale": {"range": ["#675193", "#ca8861"]},
            "legend": {"orient": "top", "title": null}}},
"config": {"view": {"stroke": null}, "axis": {"grid": false}}}.png)
ggplot2
opGHcens <- getAgeTable(country = "QA", year = 2015)

pyramidGH <- ggplot(popGHcens, aes(x = Age, y = Population, fill = Gender)) +
  geom_bar(data = subset(popGHcens, Gender == "Female"), stat = "identity") +
  geom_bar(data = subset(popGHcens, Gender == "Male"), stat = "identity") +
  scale_y_continuous(labels = paste0(as.character(c(seq(2, 0, -1), seq(1, 2, 1))), "m")) +
  coord_flip()
pyramidGH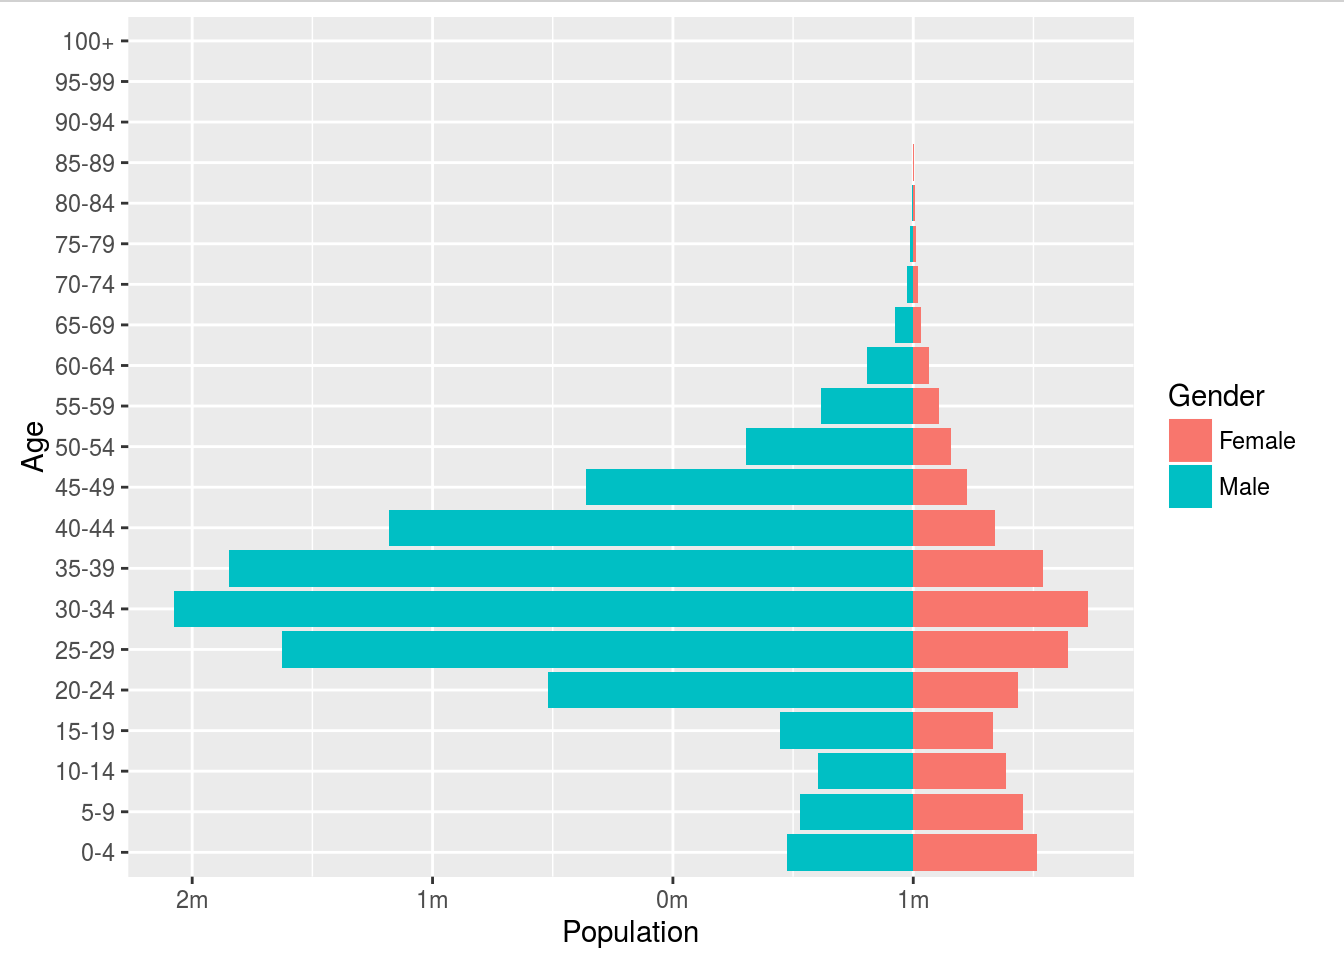
For a JavaScript programmer, this isn't as big of a deal. JavaScript programmers can just use the vega and vega-lite APIs to construct their plots from the values in their program. But for Clojure programmers who aren't interfacing directly with a JavaScript runtime, we must make do with the specification, because we don't have an algebra.
But the algebraic operators offer another important benefit of a well-chosen notation: the ability to embed predictable rules for composition in a syntax that hides unnecessary detail.
When you construct a vega-lite plot specification, you have to remember all the rules for what goes where in order to facet and compose things properly. A schema helps with machine validation, but it is too complex to keep in your head while working. If you combine the wrong operators in ggplot2 you can get some strange (or interesting) looking results, but with vega-lite you're more likely to just get a syntax error that doesn't give you as robust visual feedback on what you're trying to do. Just on a practical level, the number of characters you need to edit to rework how a plot is composed in ggplot2 compared to vega-lite means that it's much faster to iterate towards the plot you had originally envisioned. Fast feedback matters.
Another drawback is highlighted by the vega-lite specification for the population pyramid: the aggregation operator. The idea of wrapping function names in strings deeply offends my aesthetic sensibilities as a programmer. It also has practical drawbacks: either it means that the set of operations we can perform is a closed set of predefined, enumerated functions named by plain strings, or we have to deal with parsing a function name out of a string, validating it, and then evaluating it. We don't have to resort to such workarounds as Clojure programmers because our code is data. ggplot2 doesn't have to resort to those workarounds either, because functions are first-class objects in the specification of a plot. R has an extremely flexible evaluation model that should look somewhat familiar to Lisp programmers.
We shouldn't accept the limitations of other languages and tools when we know our own language is more capable and more expressive.
Removing the quotes
Using examples from the ggplot2 book
ggplot(mpg, aes(displ, hwy, colour = class)) +
geom_point() +
geom_smooth(method = "lm", se = FALSE) +
theme(legend.position = "none")
One of the ways I think we, as Clojure programmers can do better, is that the method can be specified by a symbol that defines a function. One could even imagine doing the same thing for geometry.
Acknowledements
Thanks to members of the Clojure data science community for their thoughts and feedback on drafts of this post.